The Biggest Storm Ever Measured | Typhoon Tip True Story

🎬 The video premieres soon
In October 1979 a disturbance near Pohnpei grew into the largest and most intense tropical cyclone ever recorded. Typhoon Tip reached a record-low pressure of 870 hPa, winds of 305 km/h and a windfield 2,220 km wide, almost double the old record. How did a weak, wandering system, held back by another storm, explode into a monster in just a few days? What did US Air Force crews find when they flew inside it? And why do scientists now ask whether Tip really still holds the title? Follow the storm from Micronesia past Guam, across the Pacific and into Japan, and discover the records, the damage and the unanswered questions.
Chapter 1The Pressure Reading That Shocked the World
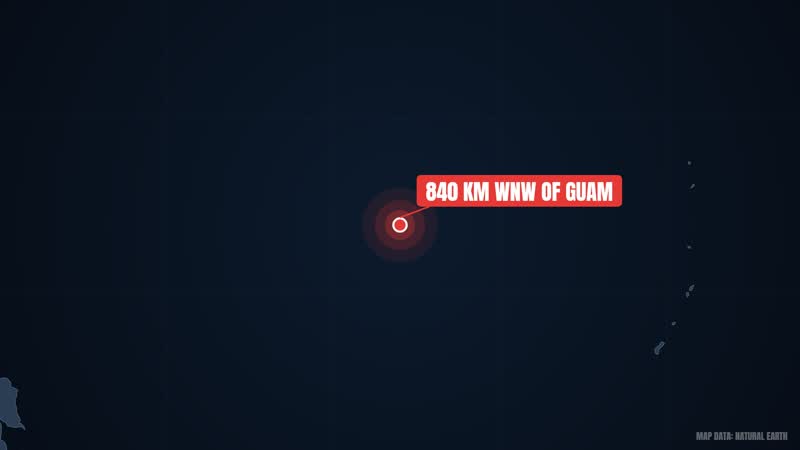
On the morning of 12 October 1979, a US Air Force aircraft flew into a storm in the western Pacific. The crew saw a number that went down in history: 870 hPa. It was the lowest sea-level pressure ever recorded in any tropical cyclone. The 1-minute sustained winds had reached 305 km/h. The spot was about 840 km west-northwest of Guam.
The storm was Typhoon Tip, known in the Philippines as Warling. Its eye was only 15 km wide, and the temperature inside the eye was 30 degrees Celsius, which was described as exceptionally high. But the eye was small, not the storm. Its windfield measured 2,220 km across, making it the largest tropical cyclone ever recorded.
So how did the storm grow so large? What did it do to Japan? And does the record still stand today? On this journey we will first understand what a tropical cyclone is. Then we will follow Tip's birth, its passage near Guam, and its rapid strengthening. Finally we will look at its impact on Japan, its records, and whether another storm could have surpassed it.
So let's start from the beginning. The story starts with a simple question: what exactly is a tropical cyclone?
Chapter 2What Is a Tropical Cyclone?
A tropical cyclone is a rapidly rotating storm system with low pressure at its center and a spiral of thunderstorms around it. It has a closed low-level circulation. When mean surface winds exceed 65 km/h, it is counted as a proper cyclone. The name depends on the place. In the Atlantic or northeastern Pacific it is called a hurricane, while in the northwestern Pacific the same storm is a typhoon. In the Indian Ocean and South Pacific, such storms are usually just called tropical cyclones. The names differ, but the physics is the same.
Where does the power come from? The answer is warm ocean water. Water evaporates from the surface and fuels these storms. When moist air rises and cools, it turns into clouds and rain. This differs from mid-latitude storms such as nor'easters.
Certain conditions are needed for formation: a sea surface temperature of about 27 degrees Celsius, low vertical wind shear, moisture in the air, and atmospheric instability. Another key ingredient is the Coriolis force, which comes from the rotating Earth. That is why cyclones usually do not form within 5 degrees of the equator. A tropical cyclone is typically 100 to 2,000 km in diameter, so some are small and some are very large. Each year the world averages 86 tropical storms. Of these, 47 reach hurricane or typhoon strength, and 20 become intense cyclones.
The northwest Pacific is the main stage of our story. Cyclones there are on average the largest, and storms form there all year round. Activity is lowest in February and March, and the peak comes in early September. Tip formed in October, a few weeks after the peak.
Now, how is strength measured? Intensity is judged by two things: wind speed and pressure. The lower the pressure, the more severe the storm generally is. Systems like the Saffir-Simpson scale and Australia's scale assign categories by wind speed alone. Records are set on both measures. The lowest-pressure record belongs to Typhoon Tip: 870 hPa, measured in 1979. The record for the highest maximum sustained wind belongs to Hurricane Patricia, at 345 km/h in 2015. We will return to this in the last section.
Now we have the basics. The question is: what happened in 1979 that turned an ordinary disturbance into the biggest storm in the world?
Chapter 3Three Disturbances and a Rival Called Roger

In late September 1979, three separate circulations formed inside the monsoon trough, which stretched from the Philippines to the Marshall Islands. The westernmost disturbance became a tropical depression west of Luzon on 1 October. That system later became Typhoon Sarah on 7 October. On 3 October, Tropical Storm Roger formed southwest of Guam. The same day, a third disturbance formed south of Pohnpei. This one would become Tip. So there were three systems in one monsoon trough, each with a different outcome: one became Sarah, one Roger, and one Tip.
Roger was more than a neighbor. Its circulation pulled the strong flow coming across the equator toward itself. As a result, Tip's precursor disturbance got little chance to develop significantly at first. A strong neighbor was blocking its path. Even so, the disturbance kept organizing slowly as it moved west. It was not ready to give up.
Roger's large circulation also made Tip's path strange. It moved erratically and very slowly, making a cyclonic loop southeast of Chuuk. This was the mutual effect of two storms in the same area: Roger's winds held back Tip's growth and also changed its course.
Late on 4 October, a reconnaissance aircraft flew into the system and confirmed a closed low-level circulation. Early the next morning, 5 October, the Joint Typhoon Warning Center issued its first warning for Tropical Depression Twenty-Three-W. Note that these were two separate stages: confirmation of the circulation on 4 October, and a formal warning on 5 October. It was the 43rd tropical depression of the 1979 Pacific typhoon season, and the system later became that season's third super typhoon.
During another loop near Chuuk, the depression strengthened into Tropical Storm Tip, but Roger's influence kept it from organizing much. Tracking it was not easy either. According to satellite imagery, the apparent center was about 60 km from the real position. Reconnaissance aircraft supplied the surface circulation track, and about 60 such missions were eventually flown into Tip.
For several days Tip wandered erratically without organizing much. Then on 8 October, everything began to change. Roger had become an extratropical cyclone that day, and Tip began a steady northwest motion. Would conditions now get better for Tip?
Chapter 4Escape Past Guam

The answer was yes, conditions were changing. With Roger extratropical, the obstruction was gone, and southerly flow began to be drawn into Tip. As we saw, a tropical cyclone draws power from warm, moist air. At the same time, a tropical upper tropospheric trough was passing north of Guam. It created an excellent outflow channel north of Tip, giving the air above the storm a way out. As we saw, strong outflow helps a storm intensify quickly.
But the danger to Guam was close. The early forecast was that Tip would keep moving northwest and make landfall on Guam. Imagine a growing storm and a small island ahead of it. But in the early hours of 9 October, Tip changed course and turned west. Because of this turn, it passed about 45 km south of Guam. The island avoided a direct hit. On that same day Tip strengthened further and reached typhoon status, so a new typhoon had been born near Guam.
Did Guam escape without damage? No, but the damage was relatively small. Andersen Air Force Base recorded a total of 231 mm of rain. On 9 October, gusts of 125 km/h were measured at Naval Base Guam. At the time, the storm's center was about 70 km south of Agana. You may wonder why 45 km and 70 km differ. The sources give both figures, so we report both. Total damage on Guam was about 1.6 million US dollars in 1979 prices, which is about 6.93 million dollars in 2024 terms.
The storm's effect was not limited to Guam. Outer rainbands of Tip's wide circulation reached the Philippines, bringing moderate rain to the mountainous areas of Luzon and the Visayas, far from the storm's center.
Tip had been forecast to hit Guam, but it slipped past to the south. It was a small turn, yet it changed the island's fate. Ahead of the storm now lay the open water of the western Pacific. The sea was warm, and that warm water is a storm's real fuel. One island had narrowly escaped, and a storm had been set free.
Now the story turns to the open sea. What would happen to Tip over the next three days? The world's lowest pressure was not yet recorded, and the answer would surprise you.
Chapter 5Explosion Over Open Water
After becoming a typhoon on 9 October, Tip found very favorable conditions, and over open water it strengthened quickly. Late on 10 October its winds reached the equivalent of Category 4 on the Saffir-Simpson scale. The next day, 11 October, it became a super typhoon. Its rate of intensification was very fast.
Now consider one number. Between 9 and 11 October, Tip's central pressure fell a full 92 hPa. Pressure and wind speed together describe a storm's intensity. How unusual was a 92 hPa drop? Meteorologists call it rapid deepening when pressure falls 1.75 hPa in one hour or 42 hPa in 24 hours. In Tip the drop was 92 hPa in two days, an average of about 46 hPa per day, which exceeds that threshold.
Such a pace needs special conditions. The water must be warm, around 30 degrees Celsius or more, and warm to a depth where waves cannot bring up cooler water. Wind shear must be low, otherwise the storm's convection and circulation get torn apart. An anticyclone aloft helps by carrying air away. Tip was getting suitable conditions. According to the sources the environment was very favorable, and the trough had already opened the outflow path.
Meanwhile the storm's circulation kept expanding. Between 9 and 11 October its diameter grew to a record 2,220 km, which is about 1,380 miles. Imagine the winds of a single storm circling across such a huge area.
Then, in the early hours of 12 October, came the moment. About 840 km west-northwest of Guam, a reconnaissance aircraft took a measurement. The pressure was 870 hPa, the lowest level ever recorded anywhere in the world. One-minute sustained winds were 305 km/h.
One fine point: the Japan Meteorological Agency measures 10-minute average wind, and in its best track Tip's wind is listed as 260 km/h. Neither number is wrong. The difference is the averaging time, one minute versus ten. At that time the eye was only 15 km wide. Think of it: a storm 2,220 km across with a small, calm circle at its center.
After this Tip continued west-northwest. On the afternoon of 13 October it crossed 135 degrees east longitude. From there the area of the Philippines' weather agency PAGASA began. It issued warnings and gave the storm the local name Warling, so one storm had two names, Tip and Warling. But its records go further. Let's look inside.
Chapter 6Inside the Giant: The Records
Now let's go inside this storm. Tip's story is not only about its strength but also about its records. First, how do we know so much detail? The answer is the US Air Force. Its aircraft flew about 60 weather reconnaissance missions into this storm. That is why Tip is among the most closely observed tropical cyclones.
The first record is size. Tip's windfield diameter was 2,220 km, making it the largest tropical cyclone ever recorded. The previous record belonged to Typhoon Marge, which measured about 1,130 km in August 1951. Tip was roughly double that. To get a sense of scale, at its largest Tip was about half the size of the contiguous United States.
The second record is pressure. At 870 hPa it was 5 hPa lower than the previous record, held by Super Typhoon June in 1975. So Tip pushed the existing record down by 5 hPa. As for winds, Tip is the most powerful cyclone in the JMA's complete list.
Now to the eye. Typically an eye is 30 to 65 km wide, but Tip's eye was only 15 km across. The temperature inside it was 30 degrees Celsius, or 86 degrees Fahrenheit, and was described as exceptionally high. At the center of the eye, air sinks downward, so there are usually no convective clouds and the weather is relatively calm. But around this quiet circle is the eyewall, where winds are strongest and rain is heaviest.
The third point is the spread. After its peak, for five days the average radius of winds above 55 km/h exceeded 1,100 km. During this time Tip's winds eased to 230 km/h, but it stayed at that intensity for several days while moving west-northwest.
The sources differ on one number. In one place the windfield diameter is 2,220 km, and in another the diameter of tropical storm force winds is 2,170 km. Both figures describe the same storm but are listed differently in the sources, so we keep both.
One more point. In intense storms an eyewall replacement cycle can occur, in which an outer ring replaces the inner eyewall and the storm temporarily weakens. This is common, but our sources give no details of it for Tip.
For comparison with size, tropical cyclones are usually 100 to 2,000 km across, while the winds of 2008's Tropical Storm Marco were only 37 km wide. So Tip was the largest on one side and the lowest in pressure on the other. What happened when this giant turned toward Japan?
Chapter 7Turn Toward Japan
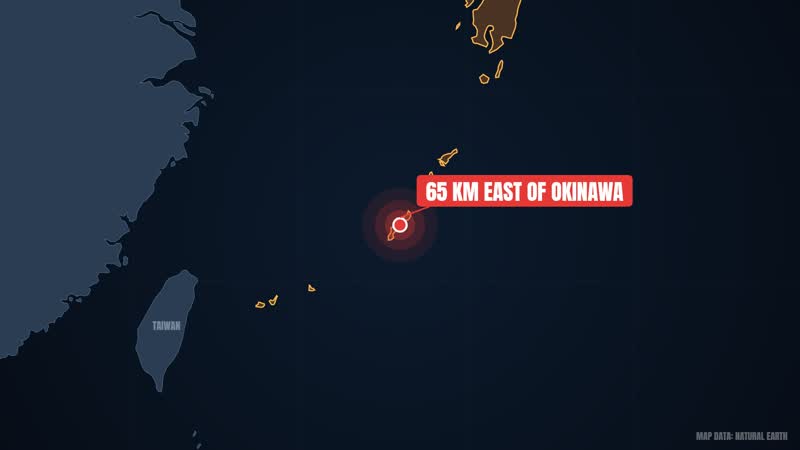
After its peak, Tip weakened somewhat. It dropped to 230 km/h and stayed at that strength for several days, moving west-northwest. According to the sources, for five days the average radius of winds above 55 km/h exceeded 1,100 km. From 17 October Tip steadily weakened and shrank. The next day, under the influence of a mid-level trough, it turned northeast, which is called recurvature. On the way, Tip passed about 65 km east of Okinawa, where sustained winds reached 72 km/h and gusts 112 km/h.
Then came 19 October. Tip made landfall on Japan's island of Honshu with winds of about 130 km/h. A few hours later it became an extratropical cyclone over northern Honshu. But it had already left great destruction behind.
The most tragic event took place at Camp Fuji, a United States Marines training facility in Shizuoka Prefecture. Heavy rain broke a flood-retaining wall there. Marines were in huts at the foot of a hill, and a fuel farm stood on the same hill. When the wall collapsed, the hoses of two rubber storage bladders came loose and a large amount of fuel spilled out. It flowed down and was ignited by a heater. In the fire, 13 Marines died and 68 were injured. The barracks were destroyed and fifteen huts were lost. The barracks were later rebuilt and a memorial was established.
In the rest of Japan, the main problem was rain. In mountain areas there were more than 600 mudslides, and floodwater entered more than 22,000 homes. Nationwide, 42 people died, 71 went missing and 283 were injured. At least 11,000 people lost their homes. River embankments broke in 70 places, 27 bridges were destroyed, and about 105 dikes were lost.
There was danger at sea too. Eight ships ran aground or sank, and 44 fishermen died or went missing. A Chinese freighter broke in two in the storm, but its 46 crew members were rescued. Here is a discrepancy: one source mentions five ships sinking, another eight ships stranded or sunk.
In Tokyo, 50-story buildings swayed. 200 trains and 160 domestic flights were canceled. Crops such as apples, rice and peaches were also destroyed. Total damage in Japan was estimated at 105.7 billion yen, about 482 million US dollars in 1979 terms, or 2.09 billion dollars in 2024 terms. Tip was described as the most severe storm to hit Japan in 13 years, a phrase that conveys its impact.
The extratropical remnants continued northeast, crossed the International Date Line on 22 October, and were last seen near the Aleutian Islands on 24 October. After so many years, does this giant still deserve to be called the world's most powerful storm? That is the next question.
Chapter 8Is Tip Still the Champion?
So is Tip still the champion? The answer is interesting. Its records technically still stand, but the word technically matters. In August 1987, routine reconnaissance aircraft flights in the western Pacific ended, so measuring storms directly from the inside stopped. After that, researchers asked whether Tip was really still the strongest, since about 60 reconnaissance missions had flown into it.
Three researchers did a detailed study. According to them, Typhoon Angela in 1995 and Typhoon Gay in 1992 had higher Dvorak numbers than Tip. On that basis they said one or both might have been more intense than Tip. But this is not proven, only a possibility.
Then there is Typhoon Haiyan in 2013. According to satellite-based estimates its core pressure may have been as low as 858 mbar, lower than Tip's 870 hPa. But the problem is the same: these storms lacked direct observations and hurricane hunters, so according to the sources no definitive data exists.
Now consider Hurricane Patricia. In October 2015 its estimated pressure was 872 hPa, and its 1-minute sustained winds reached 345 km/h. That made Patricia the second most intense tropical cyclone in the world. The record for the highest sustained wind, 345 km/h, is also hers. The National Hurricane Center wrote in its report that Patricia may have surpassed Tip, because it was undergoing rapid intensification. But there were no direct aircraft observations at the time of its peak, so according to the NHC this possibility cannot be determined.
How do we measure the intensity of storms today? One important method is the Dvorak technique, developed in the 1970s by Vernon Dvorak. It looks at visible and infrared satellite images and gives a storm a T-number from T1.0 to T8.0. The bigger the number, the stronger the storm. There are also automated methods such as the Advanced Dvorak Technique and SATCON. SATCON combines several satellite estimates into a consensus estimate. SMAP's L-band radiometer measures winds at the ocean surface and, according to the sources, has proven reliable even in high intensity and heavy rain.
Now climate change. According to the IPCC's Sixth Assessment Report, it can be said with high confidence that climate change has increased tropical cyclone rainfall. The same report says major tropical storms have likely become more frequent over the past 40 years. But there is still no consensus on overall frequency. With 2 °C of warming, the proportion of tropical cyclones reaching Category 4 and 5 is expected to rise by 13 percent. The North Pacific story is different, though. Between 1979 and 2017, cyclones there moved poleward toward cooler waters, and no increase in intensity was seen. Also, our sources do not prove that Tip can be directly attributed to climate change. It was a separate, record-breaking storm of 1979.
One more comparison, again from Japan. Typhoon Hagibis in 2019 was also very large, with a gale-force diameter of 1,528 km, and made landfall on the Izu Peninsula near Shizuoka. Hagibis caused 139 deaths, the most in Japan since Typhoon Fran in 1976. Damage is given as 17 billion dollars in one source and 15 billion in another.
Tip teaches us that direct observations are very valuable for measuring storms. And intensity forecasting is still harder than track forecasting. So, friends, Tip is still considered the largest and lowest-pressure storm, but with a question mark. If you liked the story, please like, subscribe to the channel, and tell us your suggestion for the next storm in the comments.
Shorts
The 870 hPa Reading That Changed Storm History
Premieres:
Typhoon Tip Was Heading Straight for Guam, Then It Turned
Premieres:
Typhoon Tip Dropped 92 hPa in Just Two Days
Premieres:
Sources
- Typhoon Tip — Wikipedia (CC BY-SA 4.0)
- Tropical cyclone — Wikipedia (CC BY-SA 4.0)
- Typhoon Hagibis — Wikipedia (CC BY-SA 4.0)
- Columbus Day storm of 1962 — Wikipedia (CC BY-SA 4.0)
Stock footage & photos
- By Midtrack - on Pexels
- By Christiana Dj on Pexels
- By Kindel Media on Pexels
- By Imad Clicks on Pexels
- By Adis Resic on Pexels
- By Colin Jones on Pexels
- By Nadezhda Moryak on Pexels
- By CESAR CASANOVA on Pexels
- By Tima Miroshnichenko on Pexels
- By Nishant Aneja on Pexels
- By Logan Voss on Pexels
- By Gopinath Mohanta on Pexels
- By Dancing Sky on Pexels
- By yaman ozuduru on Pexels
- By Tommaso Raso on Pexels
- By Borys Zaitsev on Pexels
- By Julien Goettelmann on Pexels
- By Matthias Groeneveld on Pexels
- By Engin Akyurt on Pexels
- By Marina Leonova on Pexels
- By David Pickup | Advertising & Marketing 🇬🇧 on Pexels
- By Rohingya Creative Production (RCP) on Pexels
- By Atlantic Ambience on Pexels
- By David Pickup | Advertising & Marketing 🇬🇧 on Pexels
- By Dancing Sky on Pexels
- By CESAR A RAMIREZ VALLEJO TRAPHITHO on Pexels
- By Ahmed on Pexels
- By Hatice Kesnik on Pexels
- By egamiFX Studio on Pexels
- By Pixabay on Pexels
- By CESAR A RAMIREZ VALLEJO TRAPHITHO on Pexels
- By Plato Terentev on Pexels
- By veysel kartalkuş on Pexels
- By Erik Mclean on Pexels
- By Esteban Llanos on Pexels
- By Dmitrijs Lasko on Pexels
- By Miguel Á. Padriñán on Pexels
- By Monstera Production on Pexels
- By Fang Mary Fang on Pexels
- By Sini Ko on Pexels
- By Olavi Anttila on Pexels
- By Kiwi and Camera on Pexels
- By Damiano Crognali on Pexels
- By Emmett Loverde on Pexels
- By Engin Akyurt on Pexels
- By utopia 36 on Pexels
- By utopia 36 on Pexels
- By Jyoti Pur on Pexels
- By Viktoria B. on Pexels
- By Lone Pictures on Pexels
- By mohd hasan on Pexels
- By Erik Mclean on Pexels
- By Elmer L on Pexels
- By Nicola Narracci on Pexels
- By Gonzalo Garcia on Pexels
- By Feel of the Nature on Pexels
- By Oknenavi K on Pexels
- By Francesco Ungaro on Pexels
- By ROMAN ODINTSOV on Pexels
- By Tetrakis Sphericon on Pexels
- By Marianna Sigov on Pexels
- By Pouya Lucky on Pexels
- By Ruslan Sikunov on Pexels
- By Gergely Meszárcsek on Pexels
- By James Anthony on Pexels
- By Mikhail Nilov on Pexels
- By Yan Krukau on Pexels
- By Ron Lach on Pexels
- By Miguel Á. Padriñán on Pexels
- By cottonbro studio on Pexels
- By RDNE Stock project on Pexels
- By Engin Akyurt on Pexels
- By 정규송 Nui MALAMA on Pexels
- By Matthias Groeneveld on Pexels
- By Matthias Groeneveld on Pexels
- By Alireza Akhlaghi on Pexels
- By Midtrack - on Pexels
- By Salva F. Ayala on Pexels
- By Engin Akyurt on Pexels
- By Ilya Klimenko on Pexels
- By Viktoria B. on Pexels
- By Waqas Ahmad Wicky on Pexels
- By Waqas Ahmad Wicky on Pexels
- By Ronald Hayward on Pexels
- By Julian M on Pexels
- By K on Pexels
- By Pixabay on Pexels
- By 3D Render on Pexels
- By Vinay on Pexels
- By Larkkid Dung on Pexels
- By Marianna Sigov on Pexels
- By Ilya Klimenko on Pexels
- By Logan Voss on Pexels
- By Taryn Elliott on Pexels
- By Gylfi Gylfason on Pexels
- By Peter Fowler on Pexels
- By Ankittt Bhattacharjee on Pexels
- By Ankittt Bhattacharjee on Pexels
- By Pavel Danilyuk on Pexels
- By Ben Garves on Pexels
- By Phát Trương on Pexels
- By MART PRODUCTION on Pexels
- By ArtHouse Studio on Pexels
- By Tima Miroshnichenko on Pexels
- By Mikhail Nilov on Pexels
- By OvO Films on Pexels
- By Anatolii Grytsenko on Pexels
- By Yasin Onuş on Pexels
- By Hamza Awan on Pexels
- By Nataliya Vaitkevich on Pexels
- By Tima Miroshnichenko on Pexels
- By Fabio Barros on Pexels
- By Marianna Sigov on Pexels
- By Pimon Kumsri on Pexels
- By Artem Stoliar on Pexels
- By Felipe David on Pexels
- By Lahcène Gaouaou on Pexels
- By Clos De La Fontaine on Pexels
- By Jul L. G. on Pexels
- By Bisan Subba on Pexels
- By Kindel Media on Pexels
- By Pixabay on Pexels
- By Dominik Zítka on Pexels
- By RDNE Stock project on Pexels
- By RDNE Stock project on Pexels
- By Kiwi and Camera on Pexels
- By Kiwi and Camera on Pexels
- By Rafael Minguet Delgado on Pexels
- By Radek Černý on Pexels
- By Engin Akyurt on Pexels
- By ROMAN ODINTSOV on Pexels
- By Ndumiso Mvelase on Pexels
- By Swapnil Kulkarni on Pexels
- By Nicola Narracci on Pexels
- By Gram Film on Pexels
- By Zelch Csaba on Pexels
- By Tommaso Raso on Pexels
- By Artem Podrez on Pexels
- By Vincuk Konan on Pexels
- By Radek Černý on Pexels
- By Radek Černý on Pexels
- By Vincuk Konan on Pexels
- By Vincuk Konan on Pexels
- By Pixabay on Pexels
- By emirkhan bal on Pexels
- By Kindel Media on Pexels
- By Tien Nguyen on Pexels
- By Mai Jose Maria on Pexels
- By Jered du Plessis on Pexels
- By Mykola Stepaniuk on Pexels
- By Giant Asparagus on Pexels
- By Claudio AFC on Pexels
- By 정규송 Nui MALAMA on Pexels
- By Kiran Varma on Pexels
- By AP Vibes on Pexels
- By Giannis Brakopoulos on Pexels
- By Giannis Brakopoulos on Pexels
- By Luis Quintero on Pexels
- By Adis Resic on Pexels
- By Adis Resic on Pexels
- By ROMAN ODINTSOV on Pexels
- By Monstera Production on Pexels
- By Martina Tomšič on Pexels
- By Tima Miroshnichenko on Pexels
- By Videas Cl on Pexels
- By Tima Miroshnichenko on Pexels
- By Kampus Production on Pexels
- By Tom Fisk on Pexels
- By Rui Veiga on Pexels
- By K on Pexels
- By Mikhail Nilov on Pexels
- By Altaf Shah on Pexels
- By Mohit Singh on Pexels
- By Be The Observer on Pexels
- By Marianna Sigov on Pexels
- By Salva F. Ayala on Pexels
- By Magda Ehlers on Pexels
- By 정규송 Nui MALAMA on Pexels
- By cottonbro studio on Pexels
- By Tima Miroshnichenko on Pexels
- By Kmeel.com Videos on Pexels
- By Mikhail Nilov on Pexels
- By ArtHouse Studio on Pexels
- By Jul L. G. on Pexels
- By Luis Quintero on Pexels
- By Ilya Klimenko on Pexels
- By Ilya Klimenko on Pexels
- By Pouya Lucky on Pexels
- By tejinder ladi photography on Pexels
- By Annie Chen on Pexels
- By 정규송 Nui MALAMA on Pexels
- By Ronald Hayward on Pexels
- By Pixabay on Pexels
- By Landon Morgan on Pexels
- By Engin Akyurt on Pexels
- By ArtHouse Studio on Pexels
- By Joel Dunn on Pexels
- By Victor Hernandez on Pexels
- By Shamnad Abdulsalam on Pexels
- By Oğuzhan Kara on Pexels
- By Oğuzhan Kara on Pexels
- By 光曦 刘 on Pexels
- By Robiul Alam on Pexels
- By K on Pexels
- By K on Pexels
- By RDNE Stock project on Pexels
- By RDNE Stock project on Pexels
- By K on Pexels
- By Metro junction on Pexels
- By K on Pexels
- By K on Pexels
- By tan hong thai 薪 鴻 泰 on Pexels
- By Kmeel.com Videos on Pexels
- By Felipe Jiménez on Pexels
- By Gram Film on Pexels
- By Clément Proust on Pexels
- By KATRIN BOLOVTSOVA on Pexels
- By MART PRODUCTION on Pexels
- By Rin Gakusho on Pexels
- By Cheng on Pexels
- By Kiwi and Camera on Pexels
- By Eyal Be on Pexels
- By Kiwi and Camera on Pexels
- By Engin Akyurt on Pexels
- By Evgenij Mikhailov on Pexels
- By David Pickup | Advertising & Marketing 🇬🇧 on Pexels
- By NGUYỄN THÀNH NHƠN on Pexels
- By Glenn Langhorst on Pexels
- By Oskar Gross on Pexels
- By Viktoria B. on Pexels
- By Altaf Shah on Pexels
- By Advancer Drones on Pexels
- By Advancer Drones on Pexels
- By Artem Podrez on Pexels
- By Artem Podrez on Pexels
- By Adis Resic on Pexels
- By Adis Resic on Pexels
- By Kindel Media on Pexels
- By Pavel Danilyuk on Pexels
- By Mario Krimer on Pexels
- By Magda Ehlers on Pexels
- By Kiwi and Camera on Pexels
- By Nino Souza on Pexels
- By Oscar Arce on Pexels
- By K on Pexels
- By Achraf Alan on Pexels
- By Engin Akyurt on Pexels
- By Armin Fardipour on Pexels
- By Kampus Production on Pexels
- By Joshua Malic on Pexels
- By Joerg Mangelsen on Pexels
- By ArtHouse Studio on Pexels
- By Mikhail Nilov on Pexels
- By Sergei Starostin on Pexels
- By K on Pexels
- By Kiwi and Camera on Pexels
- By Kampus Production on Pexels
- By Matthias Groeneveld on Pexels
- By Matthias Groeneveld on Pexels
- By Mikhail Nilov on Pexels
- By Mikhail Nilov on Pexels
- By Athena Sandrini on Pexels
- By Domenico Fasano on Pexels
- By Rafael Minguet Delgado on Pexels
- By Rafael Minguet Delgado on Pexels
- By Eren Ataselim on Pexels
- By Eren Ataselim on Pexels
- By Mikhail Nilov on Pexels
- By Artem Podrez on Pexels
- By Ronald Hayward on Pexels
- By Ronald Hayward on Pexels
- By Somogro Bangladesh on Pexels
- By Eyes2Soul Eyes2Soul on Pexels
- By Camilo Carrò on Pexels
- By YAUHENI ZAITSAU on Pexels
- By Sajjad Naqvi on Pexels
- By Manoo Media on Pexels
- By Ivan S on Pexels
- By Monstera Production on Pexels
This documentary is based on the sources above and was fact-checked before publishing. The narration voice, animated host and illustrations are AI-generated. Spotted a mistake? Tell us in the YouTube comments.